
Two box-office staff, 14,604 entries in three days — a liquor expo ticketing report
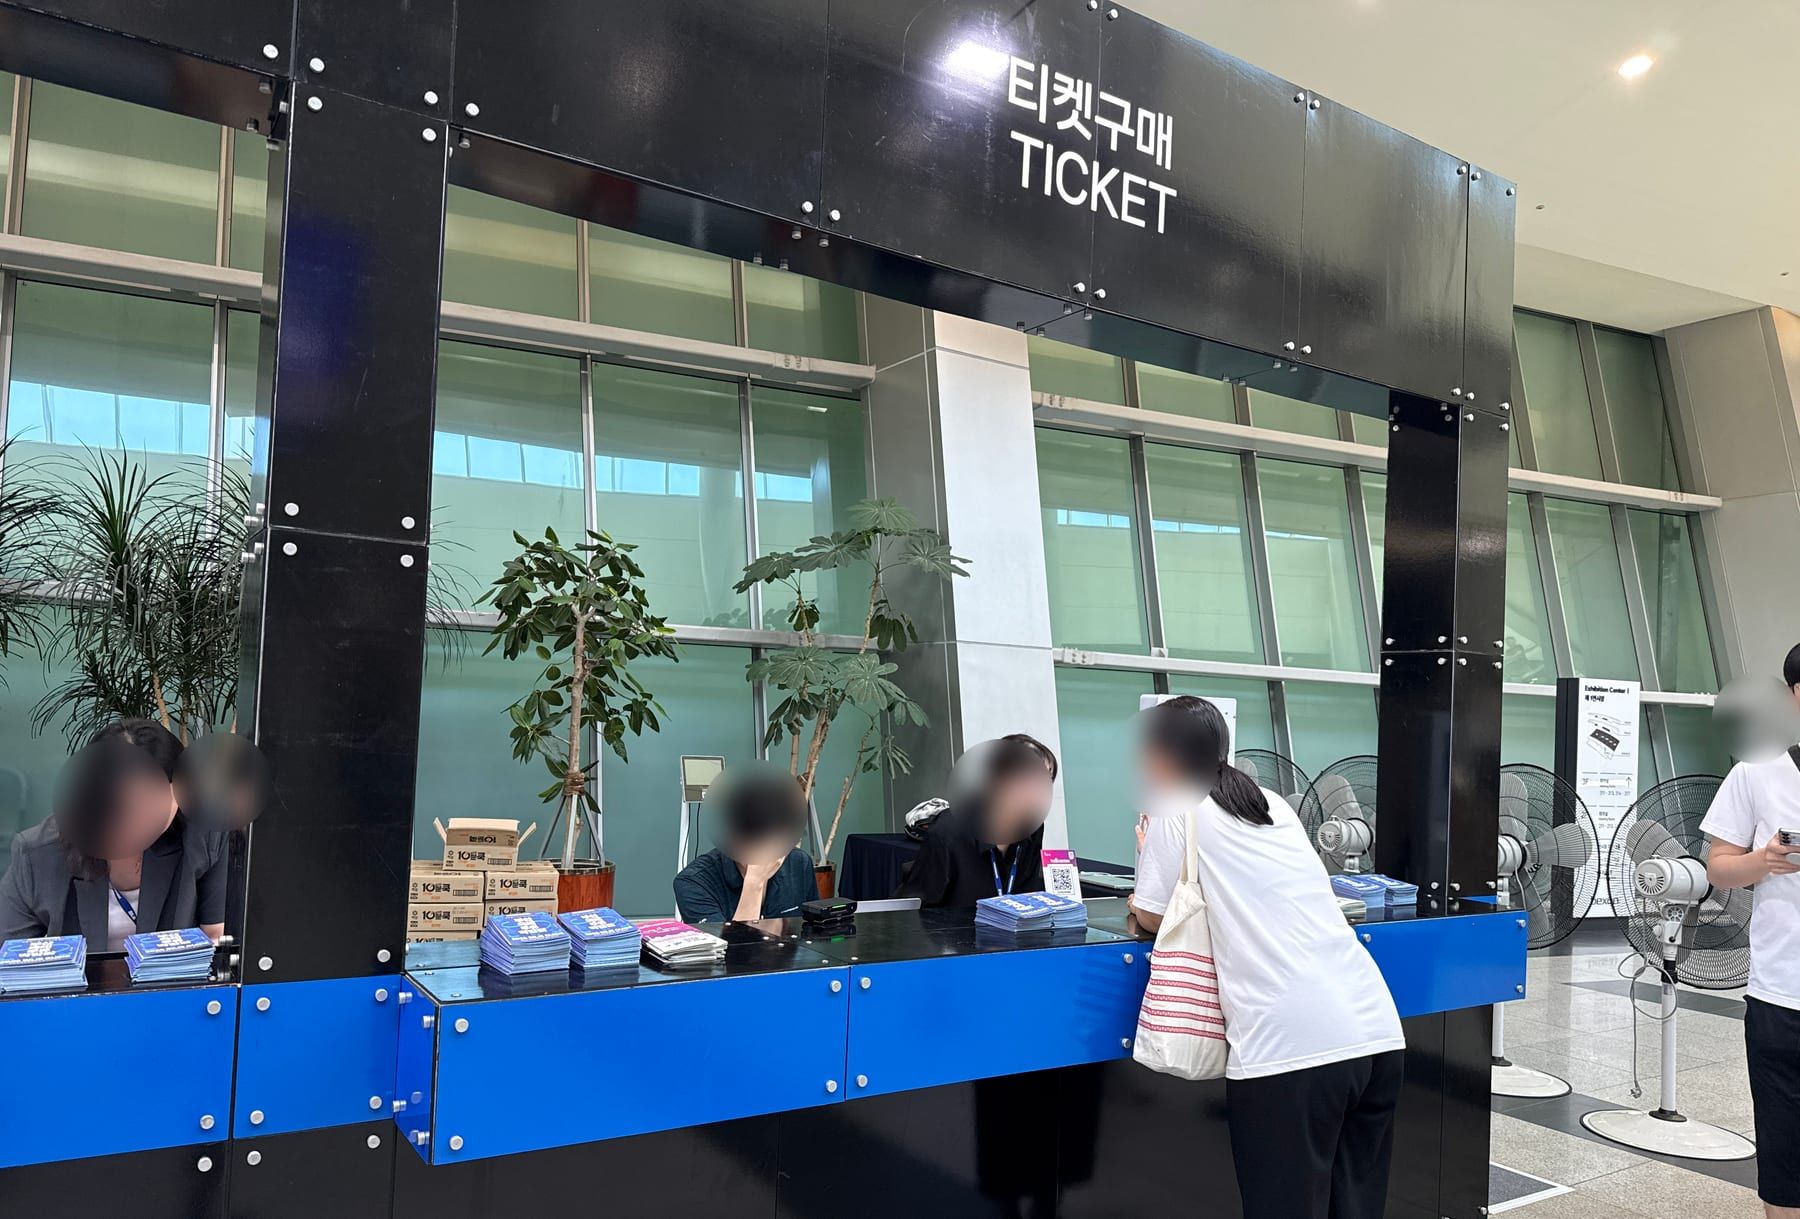
We ran ticket sales and on-site entry for a major Korean liquor expo across three days. Every number below comes straight out of the operations ledger. Nothing is estimated or adjusted.
Another large event ran in the next hall of the same venue. Its box office had eight counters and twelve staff. Ours had two. We still processed 14,604 entries at the gates over three days, with zero operational stoppages.
At a glance
| Metric | Value |
|---|---|
| On-site box-office staff | 2 |
| Estimated box-office cost saved | KRW 10.2M |
| Gate entries over three days | 14,604 |
| Peak entries per minute | 51 |
| Paid-ticket attendance rate | 93.7% |
| Visitor survey responses | 9,945 |
| Operational stoppages | 0 |
| Item | Detail |
|---|---|
| Event | Major Korean liquor expo, three days (kept anonymous pending organizer consent) |
| Data as of | Operations ledger snapshot, 2026-08-19 |
| Period covered | 2026-04-24 to 2026-08-16 (115 days) |
| Scope | Ticket issuance, entry, visitor survey (revenue and settlement figures excluded) |
Two people at the box office
Same venue, same three days. The large event in the next hall staffed its box office with eight counters and twelve people. We had two.
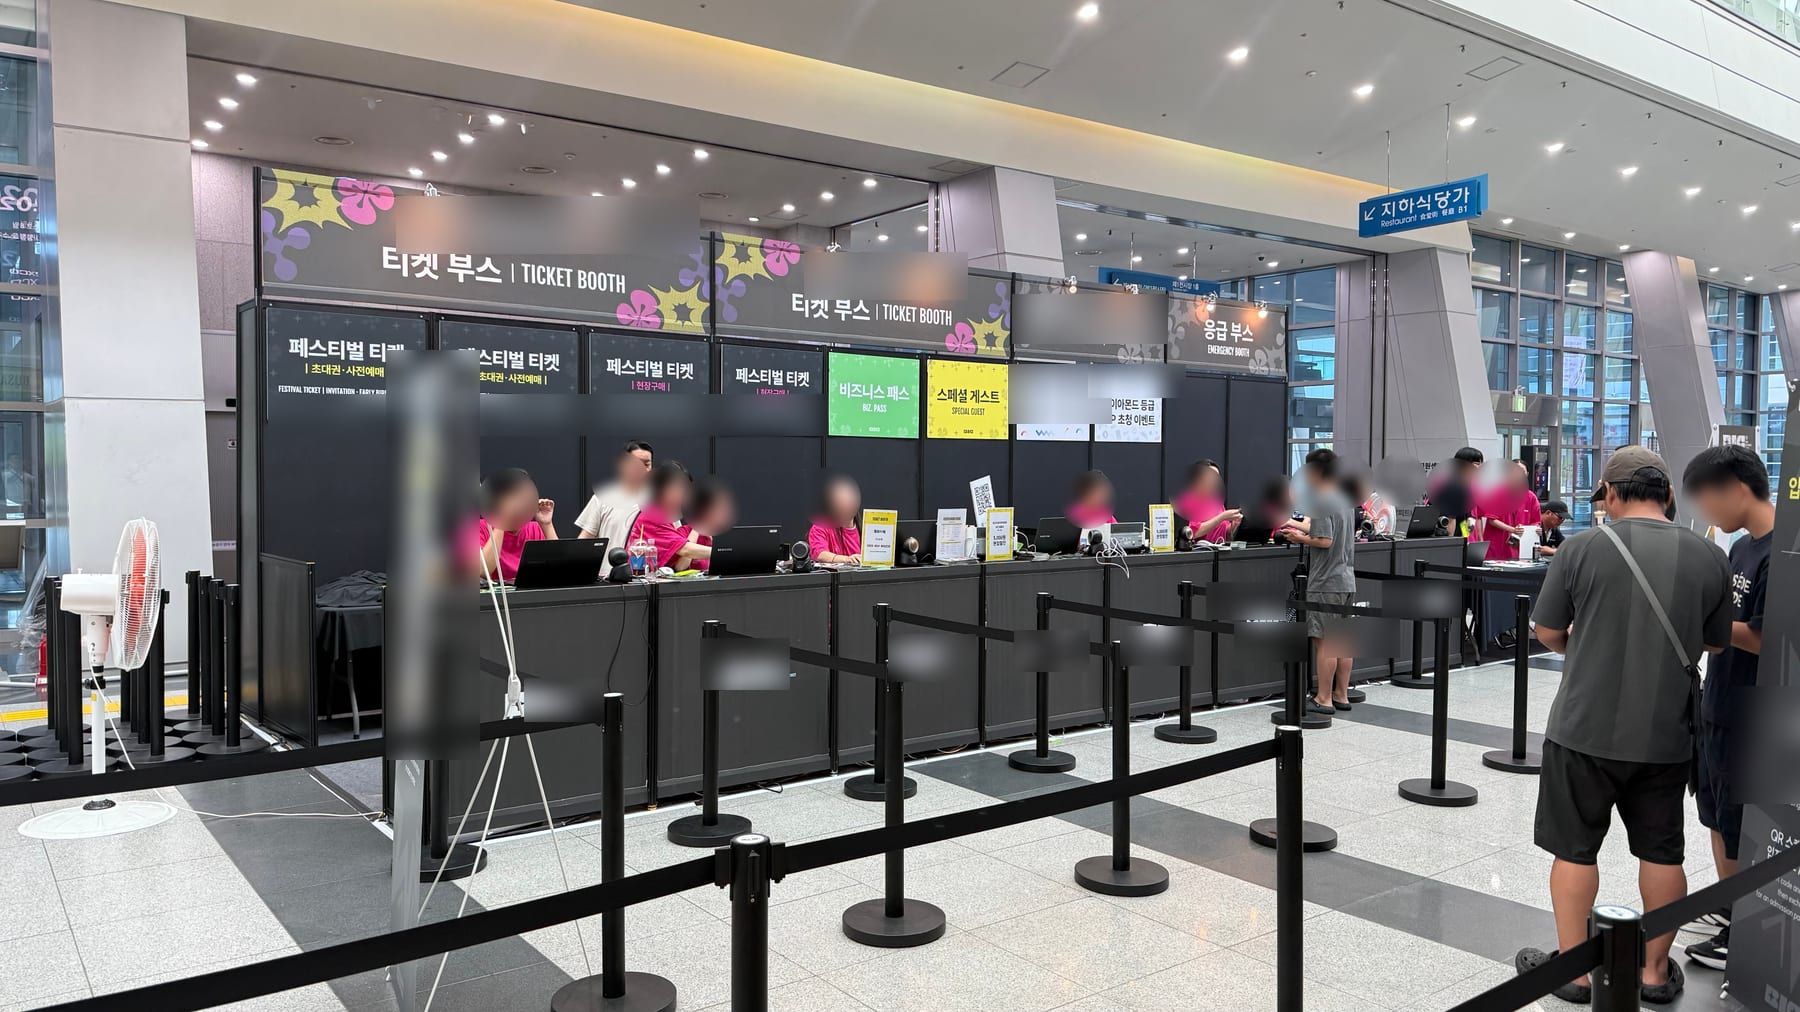
| Event in the next hall | This event | |
|---|---|---|
| Method | Staffed box office | TixPass |
| Counters | 8 | 1 |
| Staff | 12 on duty | 2 |
One sixth of the headcount, and throughput never fell behind. Those two people sold 1,366 tickets on site. Those tickets and every ticket bought online landed on the same list and passed through two gates. Three-day gate throughput was 14,604, peaking at 51 entries in a single minute.
What made the difference is not staff skill but how much work the box office has to do. Nobody prints and hands over a paper ticket, scans a printed list of names, or reconciles a cash drawer. The buyer pays on their own phone and receives the ticket on that same phone.
Box-office operating cost for a three-day event (KRW)
| Item | Staffed (12 people, 8 counters) | TixPass (2 people, 1 counter) | Difference |
|---|---|---|---|
| Box-office staff wages | 4,320,000 | 720,000 | 3,600,000 |
| Booth build and installation | 4,800,000 | 1,200,000 | 3,600,000 |
| Card terminal rental | 2,000,000 | 500,000 | 1,500,000 |
| Paper tickets and ticket printers | 1,500,000 | 0 | 1,500,000 |
| Total (estimated) | 12,620,000 | 2,420,000 | 10,200,000 |
Assumptions — KRW 120,000 per staff member per day over three days; KRW 600,000 to build and install each counter; KRW 250,000 to rent one card terminal for three days; KRW 1,500,000 to print 15,000 paper tickets and rent ticket printers.
Not included — queue marshals, cash handling and reconciliation, staff training, meals and uniforms, and reissuing lost paper tickets. Including them widens the gap. This table compares box-office operating cost only; ticketing commission is separate on both sides.
In one sentence — instead of building a bigger box office, we use the visitor's phone as the box office. Booth build, wages, terminal rental and paper tickets all fall at once, and 14,604 people walked in over those three days.
Why this event was hard
Ticketing systems rarely break because too many tickets sold. They break because tickets sold in too many places.
This event sold through six channels at once: the organizer's own web page (two payment providers), two external ticketing agencies, the on-site box office, and complimentary tickets distributed to exhibitors.
Visitors arrive at the gate without remembering where they bought. In that moment you have one second to answer "is this person allowed in?" Six points of sale, one list — that sentence was essentially the whole technical problem.
A third of the tickets sold after the event opened
Pre-sales ran for four months, yet 29.7% of all paid tickets sold during the three event days.
Daily sales highlights: 579 tickets on opening day (2026-04-24), 611 when the early-bird wave opened in early May, 429 at the late-July wave, and then the event itself (923 on 08-14, 1,745 on 08-15, 1,570 on 08-16). However long the pre-sale curve runs, the tallest peak is always on the day.
| Month | Tickets sold |
|---|---|
| 2026-04 (sales opened 04-24) | 780 |
| 2026-05 | 3,688 |
| 2026-06 | 1,200 |
| 2026-07 | 3,081 |
| 2026-08 (includes the three event days) | 5,522 |
How it ran
Three stages, with all of the hard parts pushed into stage one.
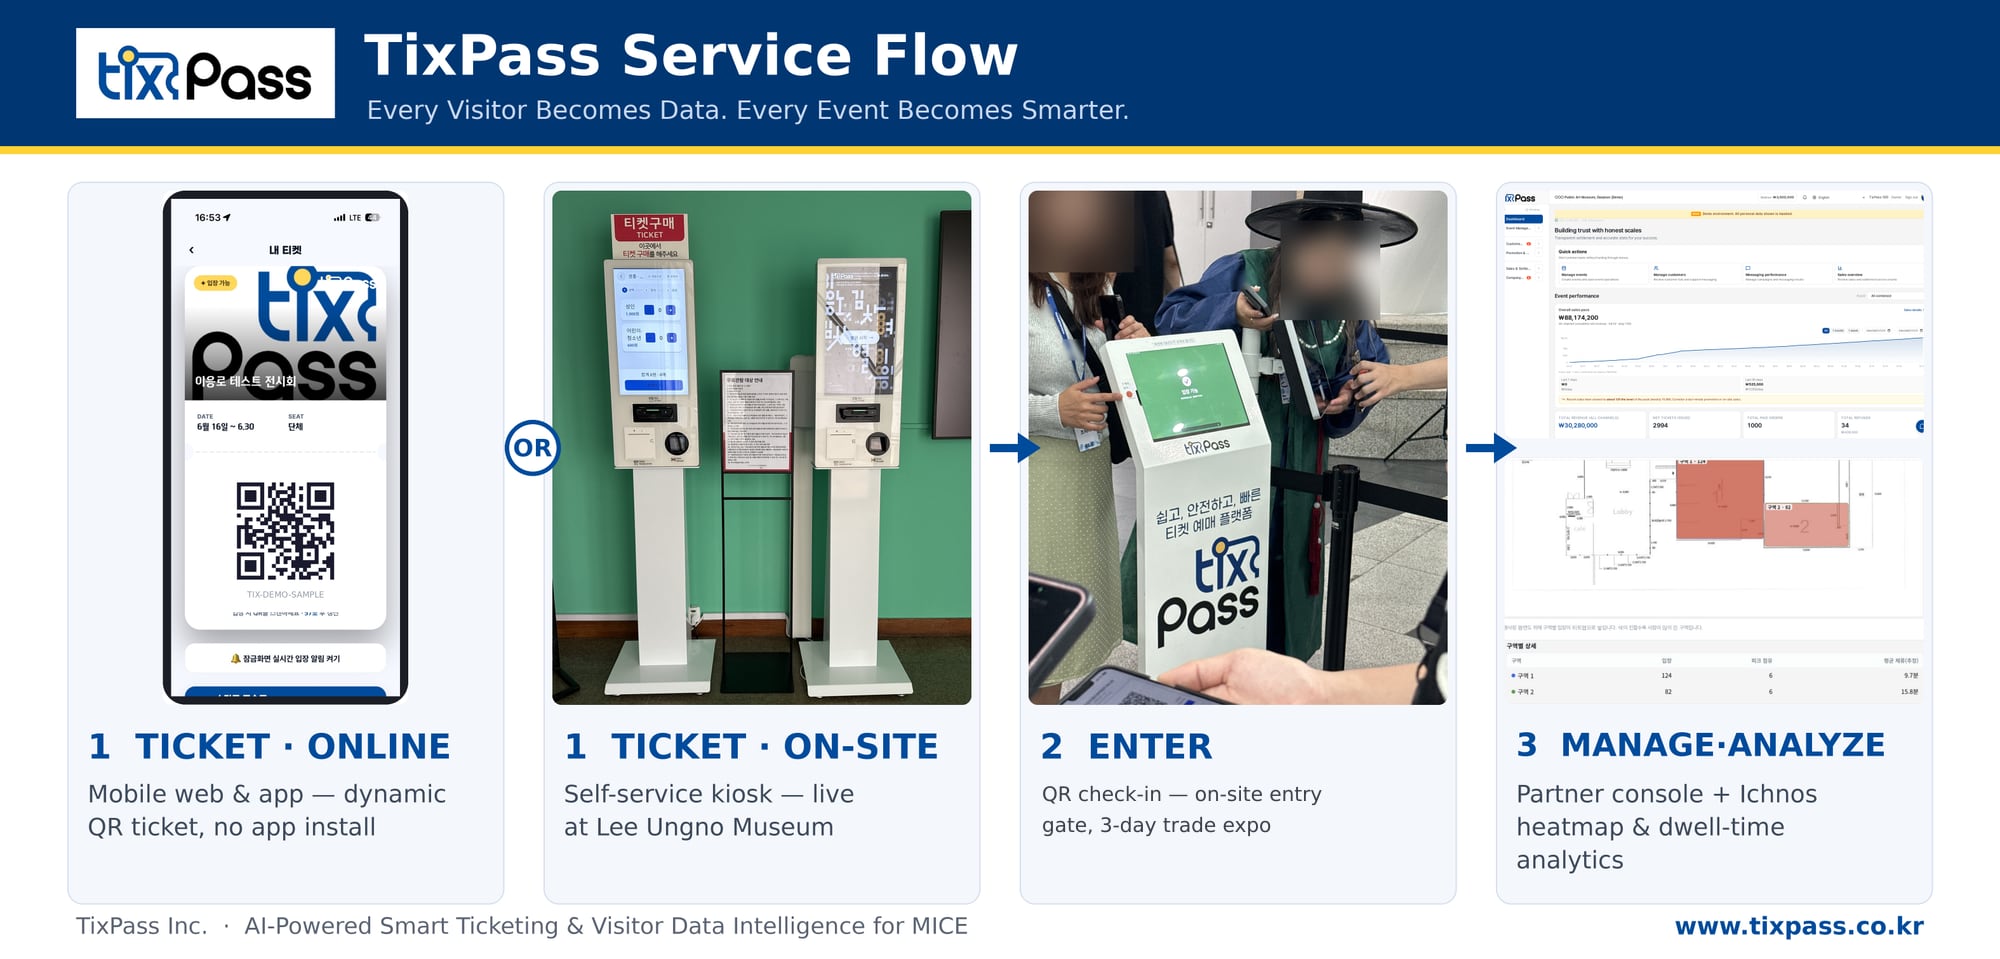
01 Tickets — one list, wherever they sell. Own web, external agencies, on-site box office, complimentary tickets. Each arrives in a different format and all of them merge into a single list. The mobile ticket goes to the buyer's phone the moment payment clears; if the messenger channel fails, the same content is sent automatically by SMS instead. 8,358 tickets went out this way.
02 Entry — one second at the gate. Scan the QR on the visitor's screen. The gate does not need to know where the ticket was sold. The QR rotates every 60 seconds, so a screenshot passed around cannot admit a second person.
03 Operations and analytics — one console. Sales and entry status in real time, plus refunds, transfers and resends. Because buyers handle most of it themselves, the organizing office fields far fewer calls. Dwell-time heatmaps by zone live here too.
Why this shape — because adding a sales channel only changes stage one. A new agency does not touch the gate scanners, the notification flow, or refunds. A channel really was added mid-event, and on-site operations did not change at all.
Four months of pre-sales
115 days from the first sale in late April to the last day of the event. 18,726 tickets were issued in that window.
Early-bird tickets opened in waves, with sales relaunched at each wave. Waves let the organizer control when and how much sells, but each one concentrates payments and deliveries into the same minutes — from the system's point of view, several small on-sale rushes.
What buyers handled themselves
- 1,807 ticket transfers — someone paid for a ticket and handed it to the person actually attending. Done on the buyer's own screen, without the organizing office.
- 711 refund requests — taken online, 706 processed and 5 declined. Handled by phone, every one of those would have been office workload.
- 8,358 automatic mobile ticket deliveries — with automatic SMS fallback when the messenger channel failed, which removes the "I never got my ticket" enquiry at the source.
What this means for organizers — the real cost of outsourced ticketing is not the commission, it is two weeks of phone calls before the event. Roughly 2,500 transfers, refunds and resends handled by buyers is that many calls the office never took.
Three days on site
The gates processed 14,604 entries over three days, using two scanners (9,533 Android, 5,071 iOS).
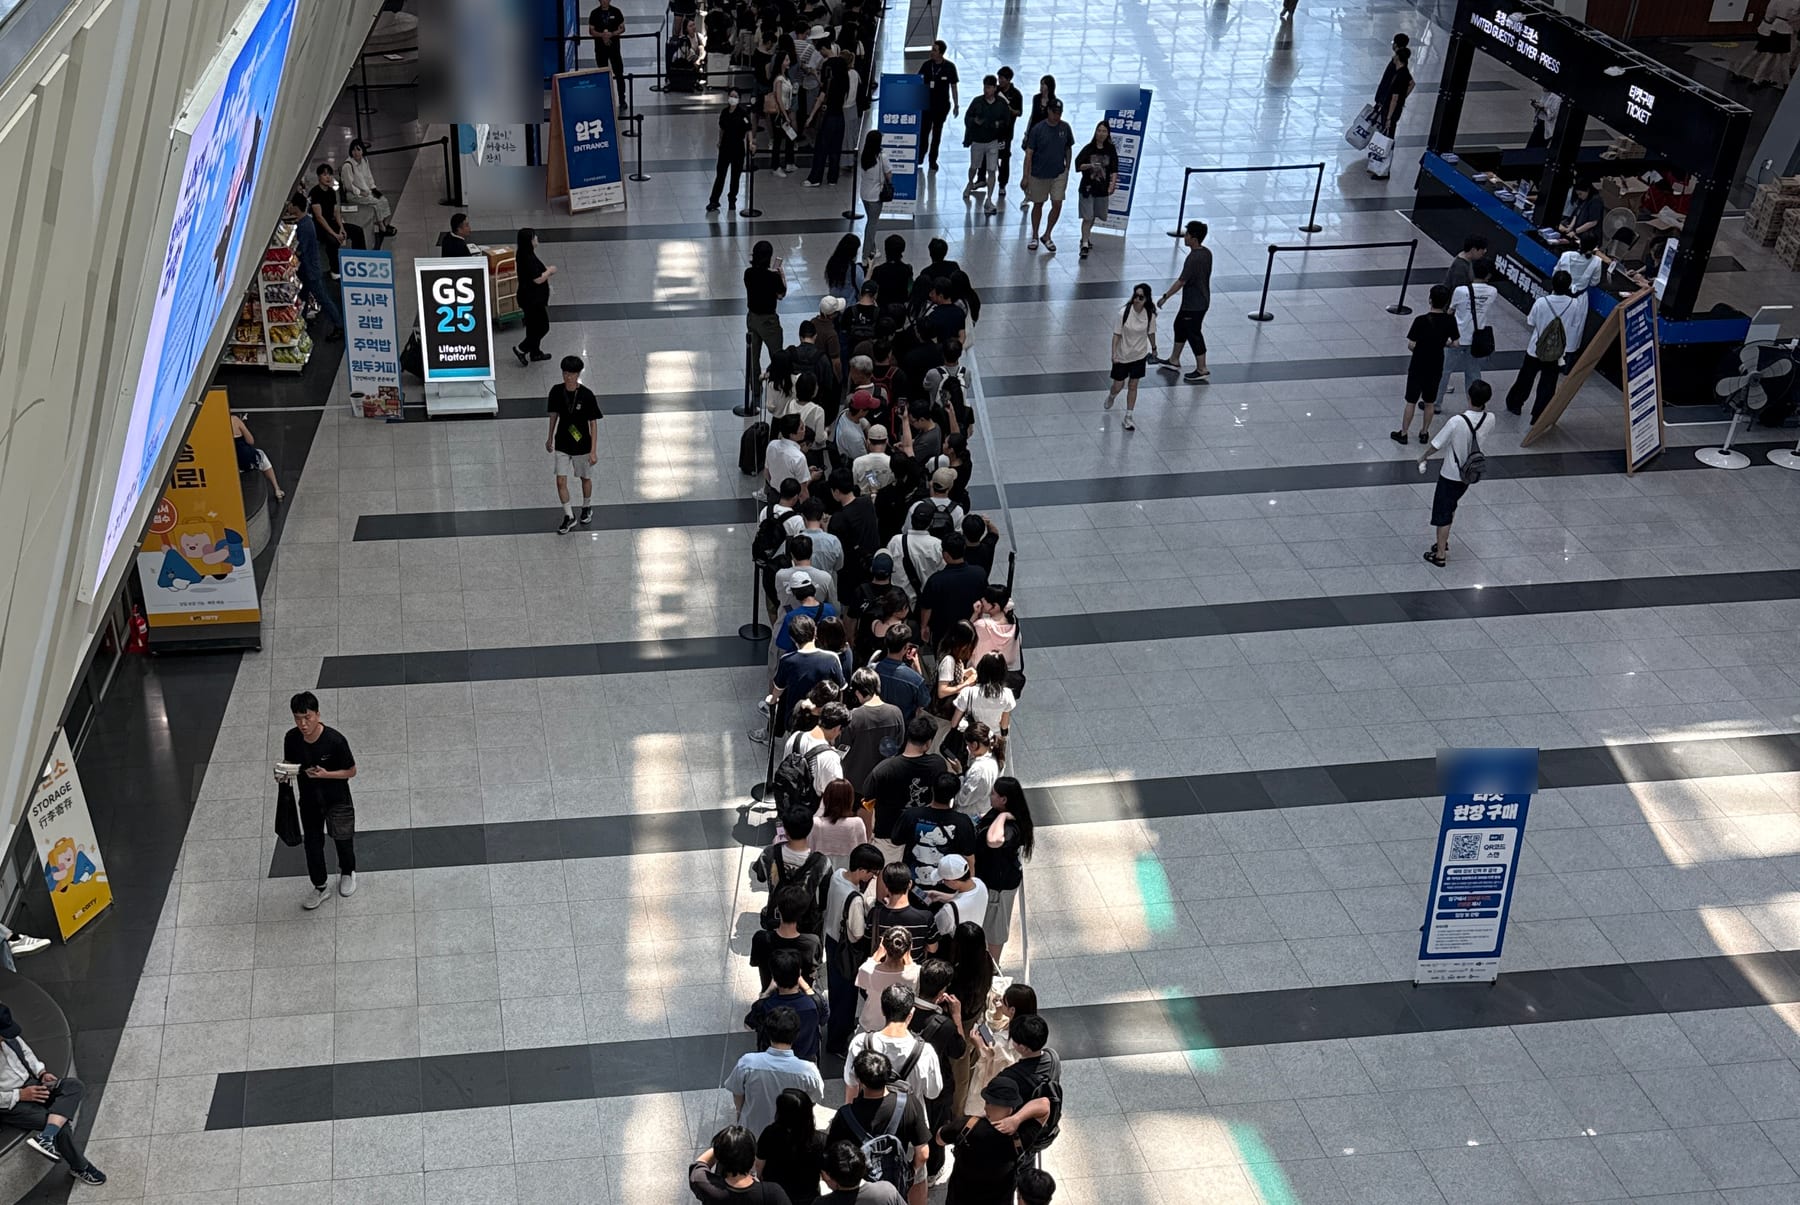
The lobby queue in the photo is the opening-time rush, formed by people already waiting before the doors opened — not a backlog. It is not a ticket queue either: everyone already has their ticket on their phone, and all that remains is the QR scan. That queue cleared at 1,467 entries per hour.
Entries by hour (both gates combined)
| Hour | Day 1, Fri 08-14 | Day 2, Sat 08-15 | Day 3, Sun 08-16 |
|---|---|---|---|
| 10:00 | 6 | 225 | 198 |
| 11:00 | 2 | 1,467 | 931 |
| 12:00 | 152 | 879 | 730 |
| 13:00 | 1,230 | 1,019 | 823 |
| 14:00 | 655 | 1,132 | 880 |
| 15:00 | 446 | 895 | 706 |
| 16:00 | 351 | 682 | 315 |
| 17:00 | 194 | 405 | 56 |
| 18:00 | 100 | 102 | — |
| Daily total | 3,144 | 6,821 | 4,639 |
The first hour after opening takes 20–39% of the day's volume (day one opened at 13:00). The 11:00 hour on day two was the peak at 1,467 entries, including 412 in the ten minutes from 11:10, and 51 in the busiest single minute.
That number matters for queue design, not for bragging. 51 per minute means each of the two scanners handled close to one person per second; below that rate the queue reaches the street within thirty minutes of opening. No request to add gates came in during the event.
Sold on site, admitted on site
1,366 tickets sold at the venue box office. On-site buyers receive the mobile ticket on their phone right after payment and walk straight to the gate. No paper tickets were printed, and on-site sales joined the same list and the same scanners as pre-sales.
Zero stoppages across three days. The systems handling sales, issuance and entry never went down during the event. Not once did a gate fail to read a ticket and fall back to checking a list by hand. Keeping the gate moving through unstable network moments was a design principle: admit the visitor first, reconcile the record behind them.
What visitors left behind
This outlasts the ticket sales. 9,945 people told us where they live, which categories they came for, and how they heard about the event.
The survey was not run as a separate campaign. It sits inside the flow of receiving the ticket: opening the mobile ticket screen after purchase asks three questions, and answering them opens the entry QR. It was a question of sequence rather than compulsion, and it collected responses equal to 79% of the 12,619 tickets actually delivered to attendees. No prize draw and no separate budget. (9,086 web responses plus 859 from the on-site POS.)
Where visitors came from (9,944 responses)
| Region | Responses | Share |
|---|---|---|
| Busan | 5,742 | 57.7% |
| Gyeongsangnam-do | 1,559 | 15.7% |
| Ulsan | 817 | 8.2% |
| Seoul | 352 | 3.5% |
| Daegu | 341 | 3.4% |
| Gyeongsangbuk-do | 320 | 3.2% |
| Gyeonggi-do | 309 | 3.1% |
| Daejeon | 83 | 0.8% |
| Jeollanam-do | 71 | 0.7% |
| Gwangju | 59 | 0.6% |
| Others (Chungnam, Incheon, Jeonbuk, Chungbuk, overseas, Sejong, Gangwon, Jeju) | 291 | 2.9% |
The southeast — the host city plus its two neighbouring provinces — accounts for 81.6%. Long-distance visitors realistically come only from the capital region and the Daegu area. Where to spend the next edition's advertising, and where to open up instead, is decided by this one table.
Categories of interest (up to three choices, 9,945 respondents)
| Category | Selections | Share |
|---|---|---|
| Whisky | 6,399 | 64.3% |
| Traditional Korean liquor | 5,616 | 56.5% |
| Wine | 5,232 | 52.6% |
| Beer | 4,769 | 48.0% |
| Other alcoholic drinks | 1,958 | 19.7% |
| Related food | 1,000 | 10.1% |
| Liquor industry | 355 | 3.6% |
| Accessories | 220 | 2.2% |
| Services | 211 | 2.1% |
| Equipment | 69 | 0.7% |
73% of respondents picked all three slots. Visitors who come for a single category are the minority, which argues for a circulating floor plan rather than strict separation by category when placing booths and tasting routes.
How visitors heard about the event (single choice, 9,944 responses)
| Channel | Responses | Share |
|---|---|---|
| Word of mouth | 3,600 | 36.2% |
| Social media (Instagram, X, etc.) | 3,143 | 31.6% |
| Other | 1,668 | 16.8% |
| YouTube | 631 | 6.3% |
| Portals (blogs, cafés, etc.) | 480 | 4.8% |
| Offline (subway ads, banners, etc.) | 422 | 4.2% |
Word of mouth and social media are two of every three. Offline advertising — subway panels, banners — accounts for 4.2%. If the offline budget is a larger share than that, the gap is the next edition's savings.
Attendance rate by sales channel (paid channels, cancellations excluded)
| Sales channel | Issued | Delivered | Entered | Attendance |
|---|---|---|---|---|
| Own web, card provider A | 5,007 | 4,452 | 4,273 | 96.0% |
| On-site POS | 1,366 | 1,307 | 1,243 | 95.1% |
| External agency A | 3,980 | 3,141 | 2,960 | 94.2% |
| Own web, card provider B | 3,740 | 3,029 | 2,717 | 89.7% |
| External agency B | 166 | 166 | 136 | 81.9% |
| Other (manual on site) | 12 | 5 | 3 | 60.0% |
| Total | 14,271 | 12,100 | 11,332 | 93.7% |
The same ticket converts into an actual entry at rates that differ by as much as 14 percentage points depending on the channel. Compare commissions alone and agencies look cheap; convert to cost per person who actually walked in and the ranking changes. Complimentary tickets behave differently and are excluded here.
People who buy early show up less
The further the purchase sits from the event, the more it is cancelled — and the more it is quietly abandoned.
| Purchase timing (from day one) | Tickets | Cancellation rate | Attendance |
|---|---|---|---|
| Before D-90 | 3,081 | 20.8% | 89.9% |
| D-90 to D-30 | 1,824 | 22.7% | 91.1% |
| D-30 to D-7 | 2,316 | 19.2% | 94.9% |
| D-7 to D-1 | 569 | 14.8% | 93.8% |
| During the event | 4,310 | 3.9% | 96.7% |
One in five tickets bought three months ahead is cancelled, and a tenth of the rest never shows up. Tickets bought during the event cancel at 3.9% and attend at 96.7%. When setting early-bird discounts, the calculation is not "sell early to lock it in" but "the earlier you sell, the more leaks".
What an organizer can do with this — (1) reallocate the next edition's advertising to match measured referral shares; (2) design early-bird discount depth alongside cancellation rates; (3) give exhibitors a numeric profile of who actually attends, to justify booth fees; (4) arrange transport and hotel partnerships only where long-distance visitors actually come from.
Privacy and security
A ticketing system handles buyers' names and phone numbers. A breach ends the company, not just the event.
- No personal data in the QR. Capturing and decoding a QR yields no name, phone number or order ID.
- The QR rotates every 60 seconds. Passing a screenshot around a group chat does not admit anyone.
- Permissions are separated by purpose. The rights to process payments and the rights to process entries are different. A lost gate device cannot reach sales data.
- This article carries aggregates only. No value that could identify an individual is included in any form.
What we would cut next time
Confirmed this time
- Box-office headcount down to one sixth. Two people did what a twelve-person box office next door was doing, without falling behind.
- Six sales channels, one entry list. The gate never had to ask where a ticket came from.
- Zero stoppages across three days. A sales channel was added mid-event and on-site procedure did not change.
- Fewer calls to the organizing office. Roughly 2,500 transfers, refunds and resends were handled by buyers themselves.
Still on the list
- From two box-office staff to zero. No self-service kiosk was deployed at this event. Moving on-site sales to kiosks leaves only guidance staff at the box office — a setup already running at other venues.
- Ticket delivery confirmation in one place. Delivery is automatic, but the final delivery result stays with the external messaging provider. Surfacing "did this visitor receive their ticket?" directly in the console is still to be built.
- Automatic settlement reconciliation. Matching settlement files from external agencies against internal records still involves some manual comparison. This becomes the first bottleneck as events grow.
- Movement and dwell-time analytics. This report stops at entry. Adding visitor routes and dwell time by zone would sharpen both booth placement and booth pricing.
Frequently asked questions
Doesn't cutting the box office to two people make the queue longer?
The ticket queue and the entry queue are different things. At this event visitors paid on their own phone and received the ticket on that same phone, so most of the reason to stand at a box office disappears. What remains is the QR scan at the gate, and across 14,604 entries over three days no request to add gates came in. The busiest single minute passed 51 people.
Doesn't selling through many channels break entry?
This event sold through six at once — the organizer's own web with two payment providers, two external agencies, the on-site box office, and exhibitor complimentary tickets. Every channel arrives in a different format and merges into one entry list, so the gate never needs to know where a ticket was sold. A channel was actually added mid-event and on-site procedure did not change.
Doesn't a longer pre-sale lock in more attendance?
Close to the opposite. Tickets bought more than 90 days out were cancelled at 20.8%, and a tenth of the survivors never showed up. Tickets bought during the event cancelled at 3.9% and attended at 96.7%. When setting early-bird discounts, the calculation is not "sell early to lock it in" but "the earlier you sell, the more leaks".
Can someone screenshot a QR and get in with it?
No. The QR rotates every 60 seconds, and it carries no name, phone number or order ID. Passing a screenshot around a group chat does not admit anyone.
Did the 79% survey response rate come from a prize draw?
No prize draw and no separate budget. Instead of running the survey as its own campaign, it sits inside the flow of receiving the ticket — opening the mobile ticket screen asks three questions, and answering them opens the entry QR. It was a question of sequence rather than compulsion, and it collected 9,945 responses against the 12,619 tickets actually delivered.
How was the KRW 10.2M saving calculated?
It is an estimate covering four items only — staff wages, booth build, card terminal rental and paper tickets — and every unit-cost assumption is stated under the table in the article. Queue marshals, cash handling, staff training and meals, and reissuing lost paper tickets are not included; including them widens the gap. Ticketing commission is separate on both sides.
How to read this report
Every figure is aggregated directly from a single operations ledger snapshot taken on 2026-08-19. Nothing is estimated, adjusted or re-derived after rounding. Revenue and settlement figures follow a separate confirmation process and are not included here.
| Term | Definition |
|---|---|
| Issued tickets | Every ticket created by sale or invitation, including those later cancelled. |
| Delivered tickets | Tickets not cancelled and actually delivered to a recipient. Complimentary tickets count only once the recipient is registered. |
| Attendance rate | Share of delivered tickets that actually passed a gate. |
| Entries processed | Scans successfully processed at a gate, including tickets issued by other systems. |
| Purchase timing | Payment completion time counted back from day one. For external agencies, the agency's payment timestamp is used. |
| Cancellation rate | Share of tickets issued in that window that were subsequently cancelled. |
On naming — this article keeps the event name and sales channel names anonymous pending the organizer's consent.
Data as of 2026-08-19 · period 2026-04-24 to 2026-08-16 · no personally identifying information included
Planning an event? — put your own box-office costs where our assumptions sit and we will run the same comparison for you. All we need is the size of the event and how you plan to sell.
Ready to redesign your operations?
Replacing a kiosk isn't the point — rebuilding how your venue runs is.
Request a demo